
Research Brief 001
Most Philippine iGaming commentary tracks who advertises loudest. This brief tracks something more concrete: what 23 monitored operators actually put on the shelf — 15,048 distinct observed titles across 184 providers over roughly 4½ months — and how that supply relates to modeled website traffic and simulated portfolio economics.
On 7 October, HannOnline's observed listing grew by 138 titles — 47 from Pragmatic Play and 45 from Evolution. Two-thirds of the additions came from two providers, and 124 of the 138 titles already appeared at rival operators. The signature is a bulk provider integration, not a launch wave.
Context matters: Hann Online relaunched in February 2026 on PhilWeb infrastructure. Nine months post-relaunch it is still visibly scaling — and daily lobby observation catches that strategy as it executes.
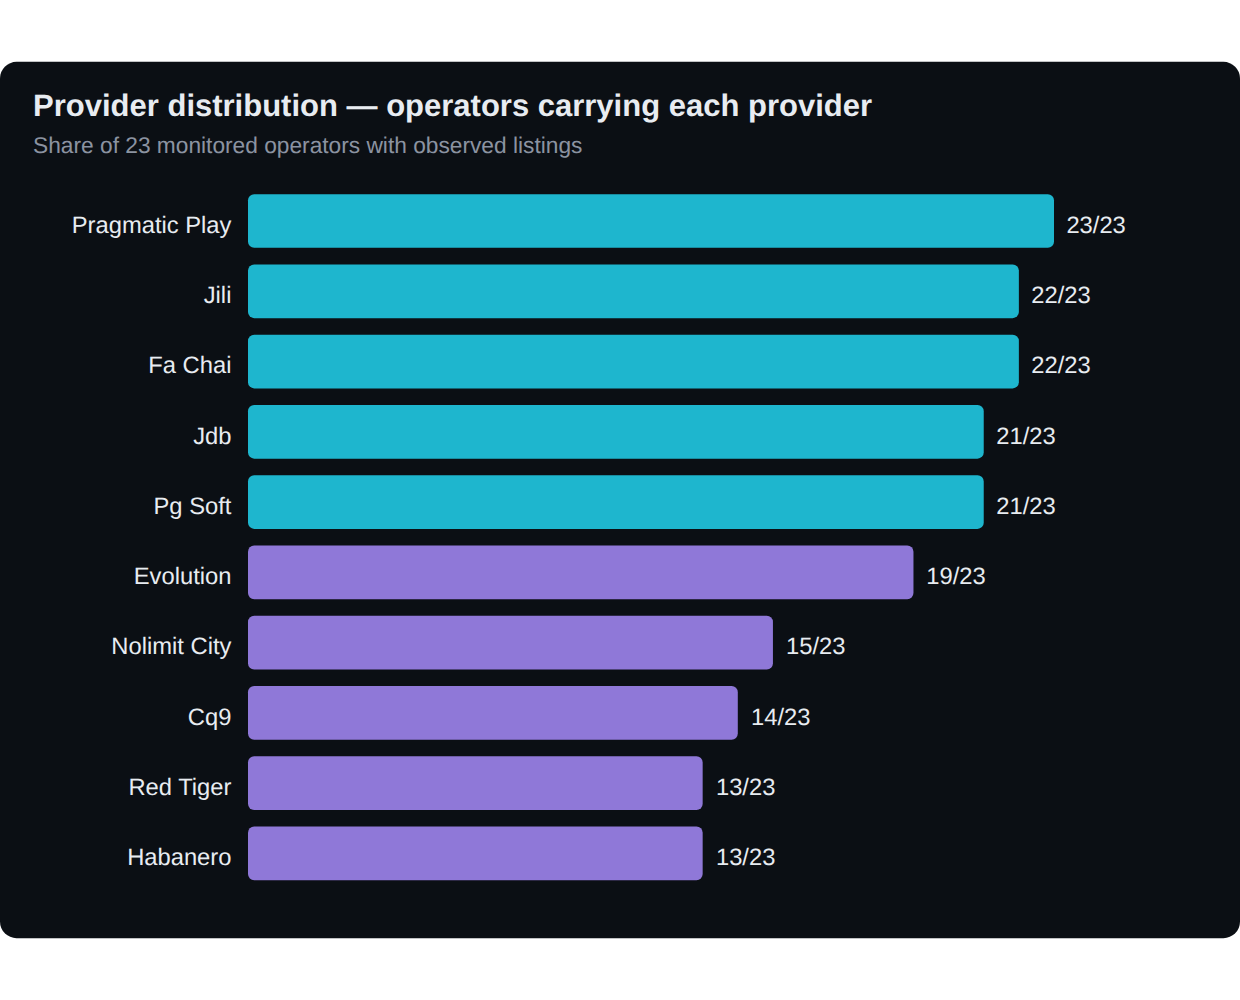
Pragmatic Play appears on every monitored operator. Carrying Pragmatic, Jili and Fa Chai is table stakes; differentiation lives in the mid-tail — Nolimit City (15 operators), CQ9 (14), Red Tiger and Habanero (13 each). Distribution breadth counts operators carrying at least one observed title — it is not market share or revenue.
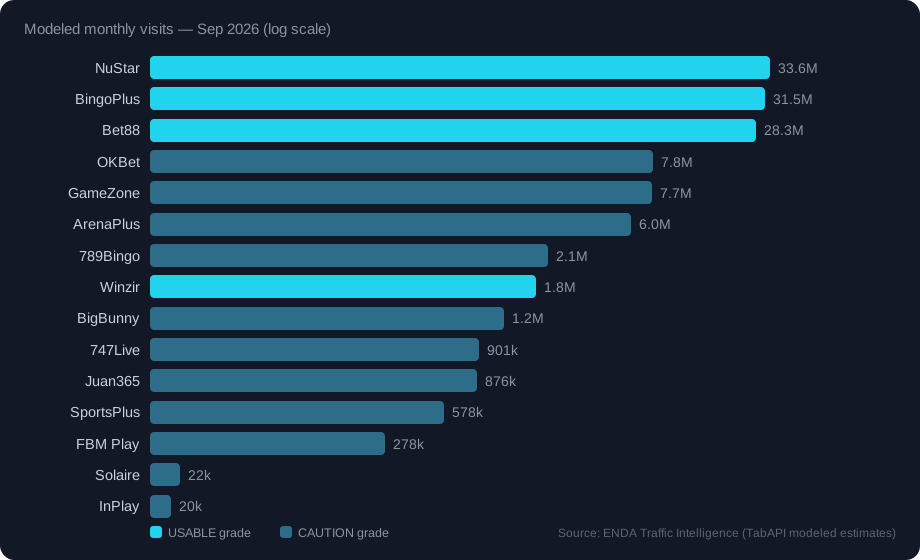
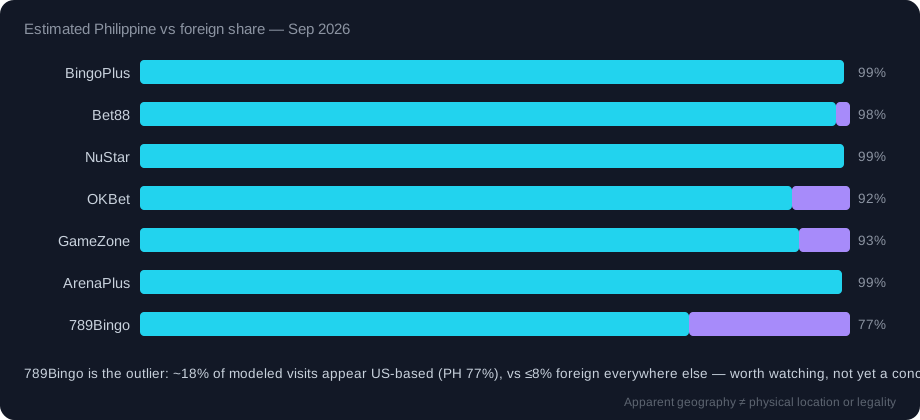
Three operators form a clear top tier — NuStar (≈33.6M), BingoPlus (≈31.5M) and Bet88 (≈28.3M) modeled monthly visits. Reliable-grade operators are 92–99% Philippine-attributed; the exception is 789Bingo, with roughly 18% apparent US-attributed share — flagged as a modeled signal, not a conclusion.
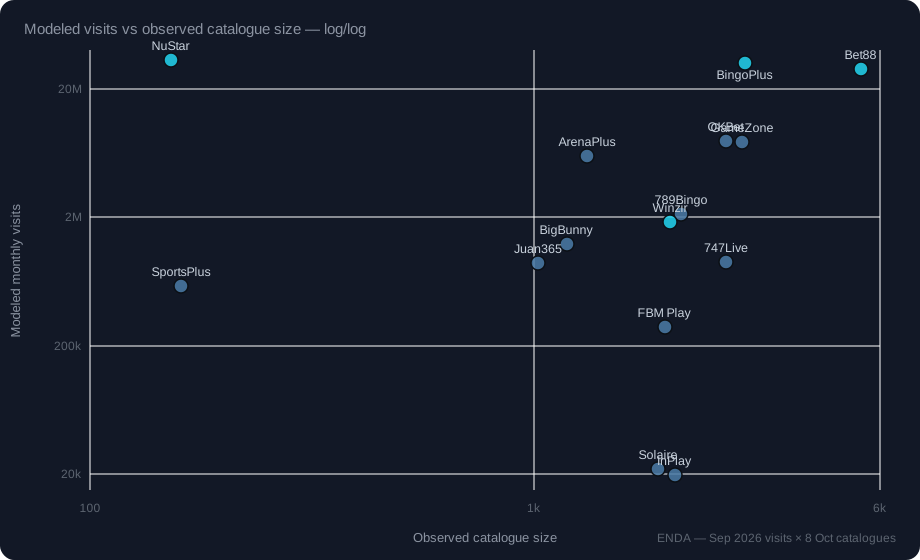
NuStar pairs the panel's smallest captured catalogue (152 titles) with its highest modeled traffic (≈33.6M), while Bet88 carries the broadest catalogue (5,445 titles) at ≈28.3M. The contrast between captured breadth and modeled audience is real — the explanations for it remain hypotheses.
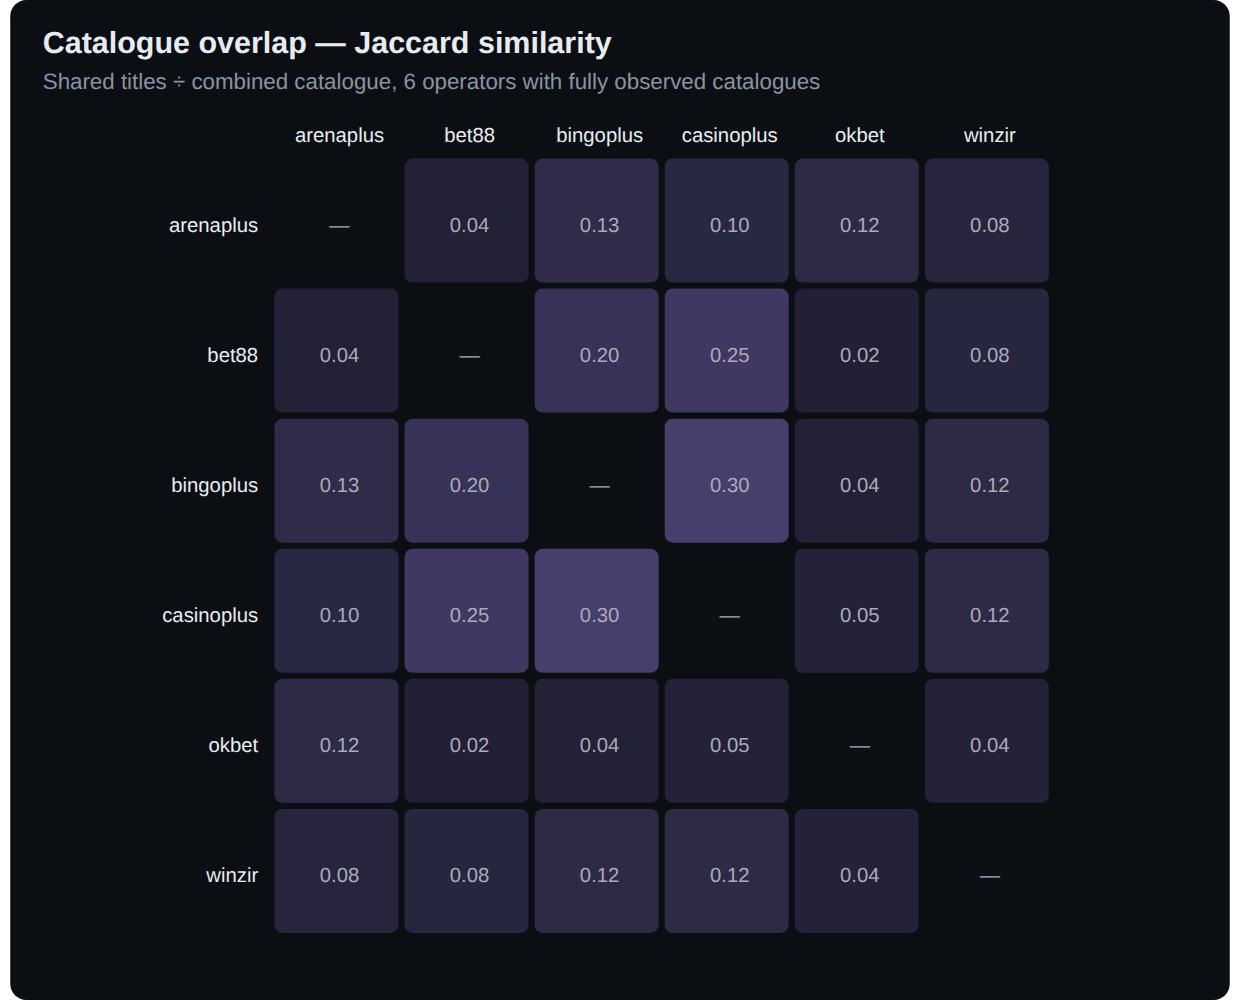
The highest pairwise Jaccard is just 0.30 (BingoPlus × CasinoPlus). Under size imbalance, containment adds context: 70% of ArenaPlus's catalogue sits inside BingoPlus's — a shared spine with differentiated tails.
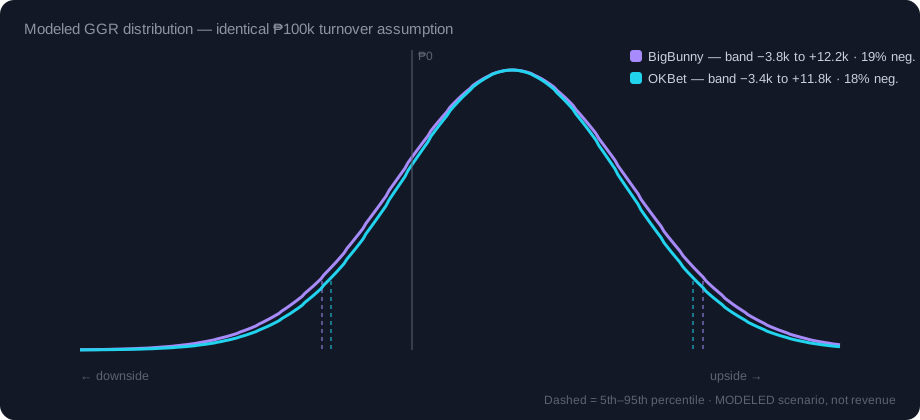
ENDA's portfolio simulator combines deterministic accounting with stochastic downside modeling over observed catalogues. Identical configured turnover across different catalogue mixes produces measurably different downside bands — the shape of the risk differs even when the mean does not.
Catalogue figures are ENDA-observed lobby listings through 8 October 2026 — coverage of the monitored panel, not the industry. Traffic figures are modeled estimates from quality-filtered canonical domains (CasinoPlus excluded pending domain-quality resolution). Simulator outputs are hypothetical scenarios under stated assumptions. Correlation does not establish causation.